Marthe Moengen

Gal in a Cube

What is OneLake in Microsoft Fabric? — 4. Oct 2023

What is OneLake in Microsoft Fabric?

OneLake in Fabric is a Data Lake as a Service solution that provides one data lake for your entire organization, and one copy of data that multiple analytical engines can process.

Microsoft Fabric is the new and shiny tool that Microsoft released May 23rd during Build. There are multiple very interesting features and opportunities that follows with Fabric, but as there already exist some great articles that give a nice overview, I want to dig into some of the spesific Fabric components more in details.

So, let’s start with the feature that to me is one of the most game changing ones. A fundamental part of Microsoft Fabric, the OneLake.

Content

  1. Content
  2. What is OneLake in Microsoft Fabric?
  3. How can you use File Explorer with your OneLake in Microsoft Fabric?
  4. File Structure in OneLake
  5. Access and Permissions in OneLake
  6. What are the benefits of OneLake?

What is OneLake in Microsoft Fabric?

First, let’s start with an introduction. In short:

OneLake = OneDrive for data

The OneLake works as a foundation layer for your Microsoft Fabric setup. The idea is that you have one single data lake solution that you can use for your entire organisation. That drives some benefits and reduces complexity:

  • Unified governance
  • Unified storage
  • Unified transformations
  • Unified discovery

Per tenant in Microsoft Farbic you have ONE OneLake that is fully integrated for you. You do not have to provision it or set it up as you would with your previous Data Lakes in Azure.

OneLake is the storage layer to all tour Fabric experiences, but also to other external tools. In addition, you can virtually copy data you have in other storage locations into your OneLake using shortcuts. Shortcuts are objects in OneLake that point to other storage locations. This feature deserves its own blog post, so for now, let’s just summarize what OneLake is with the following:

OneLake in Fabric is a Data Lake as a Service solution that provides one data lake for your entire organization, and one copy of data that multiple analytical engines can process.

How can you use File Explorer with your OneLake in Microsoft Fabric?

So, as OneLake is your One Drive for data, you can now explore your data in your File Explorer. To set this up you need to download the OneLake file explorer application that integrates Microsoft OneLake with the Windows File Explorer. This can be done through this link: https://www.microsoft.com/en-us/download/details.aspx?id=105222

After downloading the application, you log in with the user you are using when logging into Fabric.

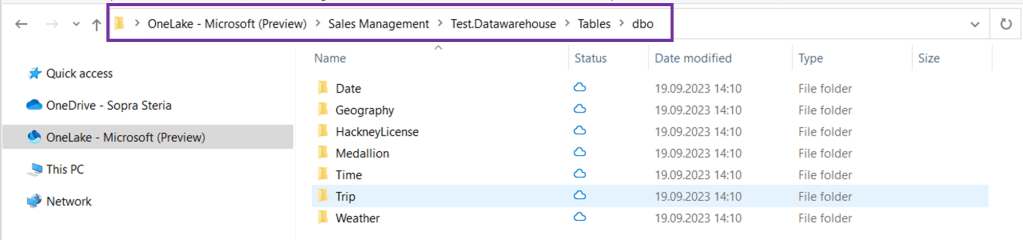
You can now view your workspaces as folders in your File Explorer.

You can then open up the workspaces you want to explore and drill down to specific tables. Below I have opened up my Sales Management workspace, then opened the data warehouse I have created in that workspace and then the tables I have in my data warehouse.

This also means that you can drag and drop data from your File Explorer into your desired Fabric folders – but not for all folders. This works if you want to drag and drop files to your Files folder in your datalake instead of uploading the files directly inside Fabric.

Below, I dragged my winequality-red.csv file from my regular folder to my Files folder inside a DataLake in OneLake.

It will then appear inside the DataLake explorer view in Fabric:

File Structure in OneLake

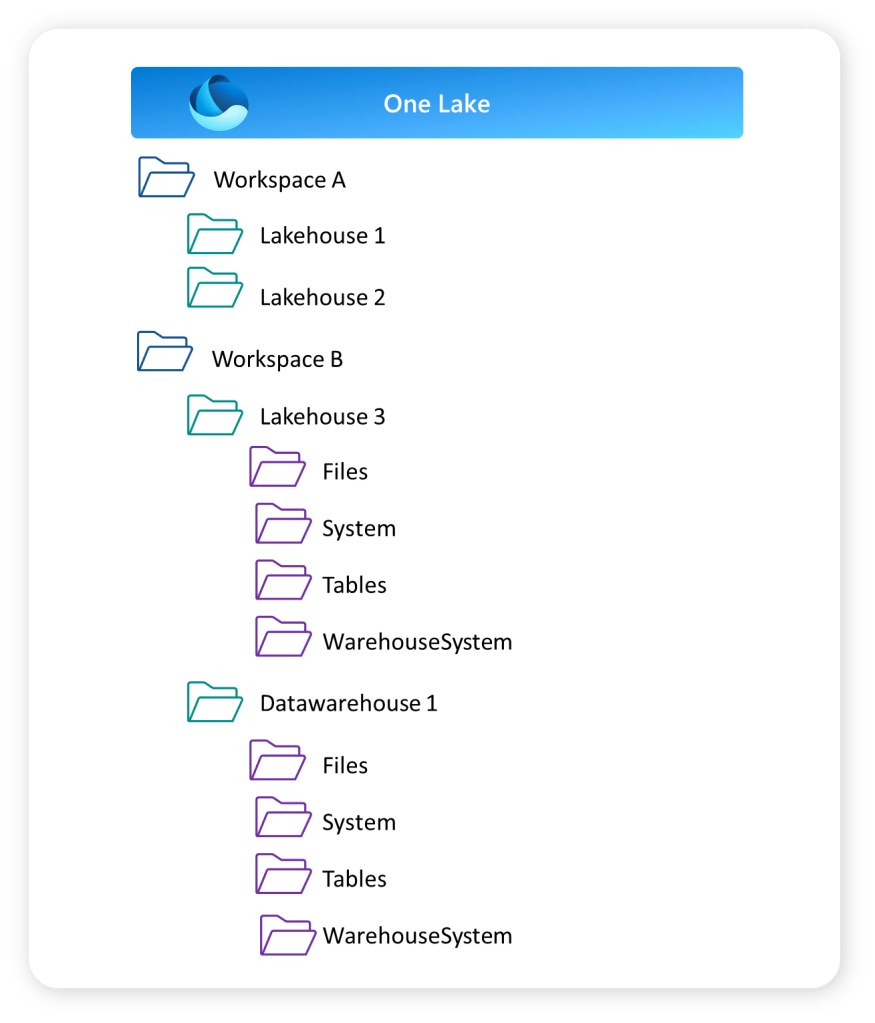
You can structure your data in OneLake using the Workspaces in Fabric. Workspaces will be familiar to anyone who has been using Power BI Service.

The Workspaces creates the top folder structure in your OneLake. These work as both storage areas and a collaborative environment where data engineers, data analysts and business users can work together on data assets within their domain.

The lakehouse and data warehouse that you might have created in your workspace will create the next level in your folder structure as shown below. This shows the Folder View of your workspaces.

Access and Permissions in OneLake

How do you grant access to the OneLake?

Inside a workspace there are two access types you can give:

  • Read-only
  • Read-write

The read-only role is a viewer role that can view the content of the workspace, but not make changes. The role can also query data from SQL or Power BI reports, but not create new items or make changes to items.

Read-write is the Admin, Member and Contributor role. They can view data directly in OneLake, write data to OneLake and create and manage items.

To grant users direct read access to data in OneLake, you have a few options:

  1. Assign them one of the following workspace roles:

    • Admin: This role provides users with full control over the workspace, including read access to all data within it.
    • Member: Members can view and interact with the data in the workspace but do not have administrative privileges.
    • Contributor: Contributors can access and contribute to the data in the workspace, but they have limited control over workspace settings.
  2. Share the specific item(s) in OneLake with the users, granting them ReadAll access. This allows them to read the content of the shared item without providing them with broader access to the entire workspace.

By utilizing these methods, you can ensure that users have the necessary read access to the desired data in OneLake.

What are the benefits of OneLake?

So to conclude, let’s try and summarise some of the benefits you get with OneLake in Fabric.

  • OneLake = One version of your data
    • No need to copy data to use it with another tool or to analyze it alongside other data sources. The shortcuts and DirectLake features are important enablers for this. These features deserve a separate blog.
  • Datalake as a Service
    • For each tenant you have a fully integrated OneLake. No need to spend time provisioning or handling infrastructure. It works as a Datalake as a Service.
  • Multiple Lakehouses
    • OneLake allows for the creation of multiple lakehouses within one workspace or across different workspaces. Each lakehouse has its own data and access control, providing security benefits.
  • Supports Delta Format
    • The OneLake supports the delta file format, which optimizes data storage for data engineering workflows. It offers efficient storage, versioning, schema enforcement, ACID transactions, and streaming support. It is well-integrated with Apache Spark, making it suitable for large-scale data processing applications.
  • Flexible Storage Format
    • You can store any type of file, structured or unstructured. That means that data scientists can work with raw data formats, while data analysts can work with structured data inside the same OneLake.
  • OneLake Explorer
    • Easy access to your OneLake with the OneLake Explorer to get a quick overview of your data assets, or upload files to your lakehouse.
  • Familiar UI
    • For any Power BI developer, the touch and feel of Fabric will be familiar.

Hope you found this blog useful! Let me know if you have started using OneLake!

Usefull links:

Join WITs Who Lunch on Meetup! — 2. Oct 2023

Join WITs Who Lunch on Meetup!

Hurray!

I’m pleased to announce the launch of WITs Who Lunch’ very own Meetup group! This is an exciting milestone in our journey, as it allows us to streamline group management and enhance accessibility for our members. With automatic notifications and calendar events, staying updated and connected will be a breeze. Moreover, our reach will expand, hopefully making it possible for us to connect with even more awesome WITs.

I want to thank all the awesome women who have contributed to our events so far!

To sign up for our meetup group, scroll down to How can I join? in this article.

If you want to learn more about this group, continue to read ❤

  1. Who are we?
  2. Who can join?
  3. How can you join?
  4. How can you contribute?
    1. Sponsor
    2. Come share your knowledge with us
    3. Spread the word!

Who are we?

Ok, so here are some stats!

Since May we have hosted three meetups, and the next one is planned in October.

  • May: Lunch – Get to know each other!
  • June: Evening Seminar – Imposter Syndrome
  • August: Evening Seminar – Power Imbalance

Safe to say, we do not only lunch!

We are currently 70 members in our closed LinkedIn group. Let me know if you want to be part of this group. The group is for sharing tips, events, insights, opinions, etc. in a closed and safe environment.

Every month we decide together when we meet, or vote on our LinkedIn group, on what the next topic should be. Topics that we are looking into are How to master LinkedIn, Failure Feast and Executive Precence.

Below you can see the wordcloud from the first survey that was sent out before we met, asking for expectations of our attendees.

Who can join?

  • You identify as a woman
  • You are working in tech
  • You are close enough to Oslo to join a evening seminar, lunch or breakfast once a month
  • You are looking for other awesome techies that you can have great discussions with, learn from and motivate!

How can you join?

Now this is easy! Just create a free membership on Meetup if you fo not have one already and join our group “WITs Who Lunch” here: https://www.meetup.com/wits-who-lunch/

If you want to join our closed group on LinkedIn to contribute to discussions and share content, contact me on LinkedIn. You can find my LinkedIn profile HERE.

How can you contribute?

Moving this concept from a “let’s just meet” to an organization gains some benefits on sponsor opportunities. We therefore welcome sponsors who would like to contribute. We don’t have many costs, but would be grateful for help with:

  • Meetup membership
  • Coffee at events
  • Snacks at event

If you are working for a company that could sponsor us please contact me through my LinkedIn profile HERE.

Come share your knowledge with us

Are you a woman that has already made it? Maybe you are a leader or an acknowledged technical expert within your field?

We would love you invite you to share your knowledge with us! If you want to contribute or know someone who might want to contact me through my LinkedIn profile HERE.

Spread the word!

If you are not able to join yourself but know other women you think might want to join, please share this blog post with them.

Why am I doing this?

After starting out in the workforce not that long ago I was a bit disappointed. There are so many amazing initiatives out there. And I am sure we have come a long way! Still, I think we can go a bit further.

Picture creds: Rodney Kidd

I am also lucky enough to be on the organizing Data Saturday Oslo and Microsoft Data Platform User Group Norway. Here I see that there are more male speakers and attendees than female. Why is that?

  • Anyone who works closely with me knows that I always nag about speaking opportunities and meetups. Still, I don’t see the changes I want happening as fast as I want them to. Is it because I am not reaching broad enough? Hopefully, this is a way to reach more of you and inspire you to join the data community.
  • I get a lot of my technical input from social media as LinkedIn and Twitter. This is also where I often discover events, meetups and opportunities to present and meet other techies. So what if I did not follow the “right people” on these social media? Would I not get all these opportunities then? Let’s, therefore, connect so we can give each other tips on tech updates and events to attend!
  • I see that there are more men attending than women at meetups and conferences. I wonder if that might be because we are missing someone to attend with. I rarely see multiple women attending together. I, therefore, hope this group will connect us so we can attend together!
  • Also, I see that men in general are great at letting each other know that they are performing well. They are so good at saying “You are doing a great job, Buddy”. Loud. At the coffee station. Or in the comments on social media. Let’s build a group where we can do more of this! I think we as Norwegian women have something to learn from our male colleagues here. Let’s try and be a bit louder in general, and also when we cheer each other on.
  • Let’s be each other’s Kitchen cabinet! I got this advice from a WIT lunch at PASS in 2022, and I love it. “Kitchen cabinet” refers to any group of trusted friends and associates, particularly in reference to a president’s or presidential candidate’s closest unofficial advisers (Wikipedia). I am hoping this could be an arena to build kitchen cabinets of trusted advisors who can give advice, help and support when needed. Hopefully, it will help you keep on going, and gain confidence and strength when needed.
  • And, I want to give a shout-out to Deborah Melkin and her blog A Woman in SQL 2023 where she digs into the numbers and basically says We need to be doing more. Reading that blog post was the last nudge I needed to – just do this! Thank you!
What are Dataflows Gen 2 in Fabric? — 16. Jun 2023

What are Dataflows Gen 2 in Fabric?

I have previously written a post on Power BI Dataflows explaining what it is, how you can set it up when you should use it, and why you should use it. I am a big fan of the Gen 1 Power BI Dataflows. So now, with the new introduction of Dataflows Gen 2 in Fabric, I had to take a deeper look.

In this article, we will look at the new features that separate Dataflows Gen 2 from Dataflows Gen 1. Then we’ll have a look at how you can set it up inside Fabric before I try to answer the when and why to use it. What new possibilities do we have with dataflows Gen 2?

After digging into the new dataflows Gen 2, there are still unanswered questions. Hopefully, in the weeks to come, new documentation and viewpoints will be available to answer some of these.

To learn the basics of a dataflow you can have a look at my previous article regarding dataflows gen 1.

  1. What are Dataflows Gen 2 in Fabric?
  2. What is the difference between Dataflows Gen 1 and Gen2 in Fabric?
    1. Output destination
    2. Integration with datapipeline
    3. Improved monitoring and refresh history
    4. Auto-save and background publishing
    5. High-scale compute
  3. How can you set up Dataflows Gen 2 in Fabric?
  4. When should you use Dataflows Gen 2 in Fabric?
    1. Limitations
  5. Why should you use Dataflows Gen 2?

What are Dataflows Gen 2 in Fabric?

To start, Dataflows Gen 2 in Fabric is a development from the original Power BI Dataflows Gen 1. It is still Power Query Online that provides a self-service data integration tool.

As previously, you can create reusable transformation logic and build tables that multiple reports can take advantage of.

What is the difference between Dataflows Gen 1 and Gen2 in Fabric?

So, what is new with Dataflows Gen 2 in Fabric?

There are a set of differences and new features listed in the Microsoft documentation here. They provide the following table.

FeatureDataflow Gen2Dataflow Gen1
Author dataflows with Power Query
Shorter authoring flow
Auto-Save and background publishing
Output destinations
Improved monitoring and refresh history
Integration with data pipelines
High-scale compute
Get Data via Dataflows connector
Direct Query via Dataflows connector
Incremental refresh
AI Insights support

But what is different, and what does that mean? I would say the features output destination and integration with data pipelines are the most existing changes and improvements from Gen 1. Let’s have a look.

Output destination

You can now set an output destination for your tables inside your dataflow. That is, for each table, you can decide if by running that dataflow, the data should be loaded into a new destination. Previously, the only destination for a dataflow would be a power bi report or another dataflow.

The current output destinations available are:

  • Azure SQL database
  • Lakehouse
  • Azure Data Explorer
  • Azure Synapse Analytics

And Microsoft says “many more are coming soon”.

Integration with datapipeline

Another big change is that you can now use your dataflow as an activity in a datapipeline.  This can be useful when you need to perform additional operations on the transformed data, and also opens up for reusability of transformation logic you have set up in a dataflow.


Improved monitoring and refresh history

In Gen 1 the refresh history is quite plain and basic as seen from the screenshot below.

In Gen 2, there have been some upgrades on the visual representations, as well as the level of detail you can look into.

Now you can easier see what refreshes succeeded and which ones failed with the green and red icons.

In addition, you can go one step deeper and look at each refresh separately. Here you get details on request ID, Session ID and Dataflow ID as well as seeing for the separate tables if they succeeded or not. This makes debugging easier.

Auto-save and background publishing

Now, Fabric will autosave your dataflow. This is a nice feature if you for whatever reason suddenly close your dataflow. The new dataflow will be saved with a generic name “Dataflow x” that you can later change.

High-scale compute

I have not found much documentation on this, but in short dataflow Gen 2 also got an enhanced compute engine to improve performance similar to Gen 1. Dataflow Gen 2 will create both Lakehouse and Warehouse items in your workspace and uses these to store and access data to improve performance for your dataflows.

How can you set up Dataflows Gen 2 in Fabric?

You can create a Dataflow Gen2 inside Data Factory inside of Fabric. Either through the workspace and “New”, or the start page for Data Factory in Fabric.

Here you can choose what source you want to get data from, if you want to build on an existing data flow, or if you want to import a Power Query Template.

If you have existing dataflows you want to use, you can choose to export them as a template and upload it as a starting point for your dataflow.

When should you use Dataflows Gen 2 in Fabric?

In general, the dataflows gen 2 can be used for the same purpose as dataflows Gen 1. But what is special about Dataflows Gen 2?

The new data destination feature combined with the integration to datapipeline provide some new opportunities:

  •  You can use the dataflow to extract the data and then transform the data. After that, you now have two options:
    • The dataflow can be used as a curated dataset for data analysts to develop reports.
    •  You can choose a destination for your transformed tables for consumption from that destination.
  •  You can use your dataflow as a step in your datapipeline. Here there are multiple options, but one could be
    • Use a dataflow to both extract and transform/clean your data. Then, invoked by your datapipeline, use your preferred coding language for more advanced modelling and to build business logic.

The same use cases that we had for dataflows Gen 1 also apply to dataflows Gen 2:

Dataflows are particularly great if you are dealing with tables that you know will be reused a lot in your organization, e.g. dimension tables, master data tables or reference tables.

If you want to take advantage of Azure Machine Learning and Azure Cognitive Services in Power BI this is available to you through Power BI Dataflows. Power BI Dataflows integrates with these services and offers an easy self-service drag-and-drop solution for non-technical users. You do not need an Azure subscription to use this but requires a Premium license. Read more about ML and Cognitive Services in Power BI Dataflows here.

In addition, Power BI Dataflows provides the possibility to incrementally refresh your data based on parameters to specify a date range. This is great if you are working with large datasets that are consuming all your memory – but you need a premium license to use this feature.

Limitations

But, there are also some limitations with dataflows Gen 2 stated by Microsoft:

  •  Not a replacement for a data warehouse.
  •  Row-level security isn’t supported.
  •  Fabric capacity workspace is required.

Why should you use Dataflows Gen 2?

As for the Gen 1 dataflows, Gen 2 can help us solve a range of challenges with self-service BI.

  • Improved access control
  • One source of truth for business logic and definitions
  • Provides a tool for standardization on the ETL process
  • Enables self-service BI for non-technical users
  • Enables reusability

But there are still some unanswered questions

Even though the new additions to Dataflows Gen 2 are exciting, there’s still some questions that remain unanswered.

As I read more documentation and get more time to play around with the tool, I hope to be able to update this article with answers.

  • What about version control? If you edit a dataflow as a transformation activity in your data pipeline it is important to be able to back track changes and be able to roll back to previous versions. How would that work?
  • What are the best practices? Is it best to use Power BI dataflows as the main ETL tool now, or should we use pipelines. Should dataflows be mainly used for simple transformations as cleansing, or should we perform as much transformation and logic development as possible?
    • To mainly use dataflows for simple clean up transformations and then use a notebook in a pipeline for more advanced transformations would be my first guess. But then the question on what provides best performance come up.

So, to conclude, the new dataflow Gen 2 features are awesome. It opens up some very exciting new opportunities for your ETL process. The question now is when those opportunities are something you should take advantage of, and when you should not.

WITs who Lunch — 11. Apr 2023

WITs who Lunch

Yes – finally putting this idea to life!

I will just jump right to the point – I think we need more places where we as Women in Technology can meet. That is low-key. Where we actually get the time and place to talk. Inspire each other. Learn from each other. Mentor each other.

So, I want to try and create that space. With a semi-regular meetup IRL in Oslo – and now also online for some hybrid events!

Who can join?

  • You identify as a woman
  • You are working in tech
  • You are close enough to Oslo to join a lunch once a month
  • You are looking for other awesome techies that you can have great discussions with, learn from and motivate!

Why am I doing this?

I am lucky enough to be on the organizing committee of Microsoft Data Platform User Group Norway and Data Saturday Oslo. Here I see that there are more male speakers and attendees than female. Why is that?

  • Anyone who works closely with me knows that I always nag about speaking opportunities and meetups. Still, I don’t see the changes I want happening as fast as I want them to. Is it because I am not reaching broad enough? Hopefully, this is a way to reach more of you and inspire you to join the data community.
  • I get a lot of my technical input from social media as LinkedIn and Twitter. This is also where I often discover events, meetups and opportunities to present and meet other techies. So what if I did not follow the “right people” on these social media? Would I not get all these opportunities then? Let’s, therefore, connect so we can give each other tips on tech updates and events to attend!
  • I see that there are more male attendees than females at meetups and conferences. I wonder if that might be because we are missing someone to attend with. I rarely see multiple females attending together. I, therefore, hope this group will connect us so we can attend together!
  • Also, I see that men in general are great at letting each other know that they are performing well. They are so good at saying “You are doing a great job, Buddy”. Loud. At the coffee station. Or in the comments on social media. Let’s build a group where we can do more of this! I think we as Norwegian females got something to learn from our male colleagues here. Let’s try and be a bit louder in general, and also when we cheer each other on.
  • Let’s be each other’s Kitchen cabinet! I got this advice from a WIT lunch at PASS in 2022, and I love it. “Kitchen cabinet” refers to any group of trusted friends and associates, particularly in reference to a president’s or presidential candidate’s closest unofficial advisers (Wikipedia). I am hoping this could be an arena to build kitchen cabinets of trusted advisors that can give advice, help and support when needed. Hopefully, it will help you keep on going, and gain confidence and strength when needed.
  • And, I want to give a shout-out to Deborah Melkin and her blog A Woman in SQL 2023 where she digs into the numbers and basically says We need to be doing more. Reading that blog post was the last nudge I needed to – just do this! Thank you!

How can you join?

Easy. Just sign up to our Meetup Group: https://www.meetup.com/wits-who-lunch/

Please notice that your email will be collected so that I can send out a calendar invite for the lunch.

And nothing is sponsored. This is just me, inviting you to lunch or dinner or after work hangouts. Please be prepared to pay for what you want to eat and/or drink.

How can you contribute if you are not a WIT close to Oslo?

If you are working for a company that could sponsor the coffee for this group – please contact me!

If you are a woman that has already made it (you are a leader and/or an acknowledge technical expert) and want to contribute to this group – please contact me!

If you are missing this type of arena, but not living close to Oslo – please contact me. We might be able to work something out – and you are ALWAYS welcome to join the hybrid events online.

If you are non of these things – but still want to contribute – please share this blog post with females you think might want to join. My biggest challenge now will be to have this message reach the ones in need of it!

What will this be?

Good question.

I don’t know! It will be what we want it to be. Maybe just a low-key meeting arena. Maybe we will have some sessions where we present on a topic and learn from each other. Maybe we will connect, become friends, and then the need for this group will no longer be there – at least for a while. Or maybe this will be the new WITs only Norwegian Order of Freemasons.

It is up to us!

Power BI Pro or Power BI Premium – what license should you choose? — 15. Feb 2023

Power BI Pro or Power BI Premium – what license should you choose?

So, what should you choose when looking at the different licences in Power BI? Do you really need to pay for Premium? Or is Premium in fact cheaper for your organization? What features could you take advantage of for the different licenses? And what considerations should you take when evaluating this?

Let’s have a look!

  1. What Power BI licenses are available?
    1. Free
    2. Power BI Pro
    3. Power BI Premium per User
    4. Power BI Premium per Capacity
  2. What should you consider when deciding on a Power BI license?
    1. What flexibility do we need when it comes to changing the licence in the future?
    2. Do you have any technical deal-breaker requirements?
  3. So, what should you choose?

What Power BI licenses are available?

There are four Power BI licenses to choose from. Free, Pro, Premium per Capacity (PPC) or Premium Per User (PPU).

Ordinary Workspace/AppWorkspace/App PPUWorkspace/App PPC
Free licenseNot able to accessNot able to accessGot access
Pro licenseGot accessNot able to accessGot access
PPU licenceGot accessGot accessGot access
Premium per Capacity vs Premium per User

Free

Without a license (or with the free license), you can still take advantage of Power BI Desktop. Still, you cannot share your content with others. The free license is a great place to start learning Power BI if you are curious, but not in a position to purchase a license.

If you are a report consumer and the content you want to consume is placed in a workspace connected to a Premium per Capacity, you do not need any other license than the free one.

Power BI Pro

With a Pro license, you get full developer functionality (with some exceptions that are listed in the next chapter). You can share your content with others.

If you are a report consumer, and you want to consume reports that are inside a workspace that is NOT linked to a premium per capacity license, you also need a Pro license to consume that content.

Power BI Premium per User

With a Premium per User (PPU) license you get full functionality as a developer. Essentially, you get all the Premium features on a per-user basis. You do not need an additional Pro license if you have a PPU license, as all Pro license capabilities are included.

However, if you are a report consumer you also need a Premium Per User license to be able to consume the content within a workspace that is linked to a Premium Per User license.

Power BI Premium per Capacity

With a Premium per Capacity (PPC) license you get full premium functionality. Still, as a report developer, you need a Pro or PPU license to share your reports.

If you are a report consumer, you only need the Free license to consume content that is linked to a Premium per Capacity license.

What do you get with the different licenses?

So, what are the differences between the Pro, Premium per User and Premium per Capacity licenses?

Microsoft got a great overview page where you can compare the licenses and their features HERE.

Below I have listed the differences that in my experience are the most important when considering what license to choose.

PROPremium (Per user)
$ 9.99 monthly price per user$ 4.995 monthly price per dedicated cloud computing and storage resource with an annual subscription.
($ 20 per month per user)
1 GB model size limit.
Your .pbix file cannot be larger than 1 GB
400 GB model size limit
(100 GB model size limit)
8 daily refreshes on dataset in Power BI Service48 daily refreshes on dataset in Power BI Service
Deployment Pipelines available (Application lifecycle management)
Read more on deployment pipelines in my article
Dataflows (minus the dataflow premium features)Dataflows premium features:
– The enhanced compute engine (running on Power BI Premium capacity / parallel execution of transforms)
– DirectQuery connection to dataflow
– AI capabilities in Power BI
– Linked entities
– Computed entities (in-storage transformations using M)
– Incremental refresh
Read more on dataflows in my article
Datamarts available
Read more on datamarts in my article
Embed Power BI visuals into apps
Advanced AI (text analytics, image detection, automated machine learning)
XMLA endpoint read/write connectivity
Configure Multi-Geo support (Only PPC)

What should you consider when deciding on a Power BI license?

Choosing what license fits best for your organization is not easy, and depends on individual requirements. Still, let’s see if there are any questions and considerations you could take into account when trying to decide what license you need.

What flexibility do we need when it comes to changing the licence in the future?

Deciding between the licences can for sure be a difficult decision. The great thing is that you do not have to choose and stick to that solution forever. Many start out with a Pro license, and then as the Power BI usage and adoption within the organization grows, they move over to Premium.

It is however a bit harder to move back to a Pro license if you have started developing reports and datasets that exceed the size limit or have started to take advantage of deployment pipelines, datamarts or premium features in dataflows.
Another important aspect is that you commit to the Premium per Capacity for a year, even though it is billed monthly. This also makes it difficult to move back to Pro.

Still, if you have started taking advantage of these premium features, you probably see the value of keeping the premium capacity.

How many report consumers do you have?

Price wise there is a sweet spot to evaluate here. When you have a premium capacity, you connect your workspaces to that premium capacity. That means that all the reports you publish to an app from that workspace are visible to anyone. They do not need their own pro licence to be able to consume the reports you put in these premium workspaces/apps.

So, some quick math gives us a number of report consumers where the premium feature pays off.

500 report consumers. If you know that you have that many report consumers today or expect to reach that number soon as your company grows and the adoption of Power BI increases, the Premium per Capacity license is a good choice.

Are you using Power BI on an enterprise level?

Or how large is Power BI in your organization? Are there multiple workspaces, apps, reports, data domains and business areas?

How complex is your report development process? Are your report development teams organized in different business domains, but still collaborate on content?

Do you see the need to take advantage of Deployment pipelines to improve the lifecycle management of your content, or do you want to implement source control using an XMLA endpoint?

If you are considering starting with Power BI and know that your setup requires some level of complexity, these premium features can really help you out with large enterprise deployments and workloads.

How large are your reports?

First of all – try and reduce the size of your report. Microsoft got an article listing the techniques you could consider:

Now, if you are not able to reduce the size of your reports below 1 GB, or that does not make any sense to you, the Premium per Capacity or Premium per User license sounds like a solution for you.

Do you have any technical deal-breaker requirements?

When evaluating this question you should collect the technical requirements for your organization. Based on that list, you might see some deal-breakers when it comes to choosing the Pro license.

For instance, you might need an SQL endpoint for your datamarts, or an XMLA endpoint to automate deployment that requires premium features.

You might have some data residency requirements that can only be achieved through a Premium Per Capacity license.

You will be working with datasets that are above 1 GB.

Or you want to take advantage of an incremental refresh for real-time data using DirectQuery. This is only supported for premium licenses.

Getting an overview of these requirements, and evaluating if they require Premium features is a good starting point.

Do you need some of that additional premium features, but the premium per capacity is too much?

After having evaluated all of these questions above, you might still be in need of some of the premium features but are not in a position to choose Premium per Capacity as that might be too expensive. Then Premium per User could be the solution for you if you:

  • Want some of your Power BI Developers to learn or investigate the premium features?
  • Take advantage of the advanced AI features?
  • Want to take advantage of the Deployment Pipelines to improve the lifecycle management of your content?
  • Are working with large datasets that you cannot reduce the size of?
  • Want to set up a solution for source control taking advantage of the XMLA endpoint? Read my article on source control and your options HERE.
  • Want to centralize your BI solution in Power BI Service by building re-usable dataflows and datamarts, and reducing some of the development load on your data warehouse?
  • Do not have a proper data warehouse solution in your organization and want to take advantage of the datamart feature in Power BI Service?

Still, remember: If you go with a PPU license, all consumers of that conent also need a PPU license.

So, what should you choose?

The considerations listed above are probably not covering everything you need to consider if you are in a position where you need to decide between licenses, I am sure.

Still, they might give you a starting point in your evaluation.

The decision each organization falls on depends on the requirement that exists within the individual organization.

Let’s try to sum up some key take aways:

  • If you do not see the need for the premium features to start with –> Consider starting with Pro licenses
  • If you have more than 500 report consumers –> Consider Premium Per Capacity
  • If you are a smaller organization, but still need the premium features –> Consider Premium Per User
  • If you are using Power BI in a large organization across business areas, with numerous reports and datasets and development teams –> Consider Premium Per Capacity
  • Have a look at your technical requirements. –> Some of the limitations with the Pro licenses might make a premium choice obvious for your organization.

One thing that’s also worth mentioning is that Power BI for sure focus its investment on Power BI Premium. The value provided by Power BI Premium will therefore probably increase over time.

So, what license should you choose?
The short answer: It depends.

Useful links:

Thank you to all that contribute to improve this article!

When should you use Power BI Dataflows vs Power BI Datamarts? — 13. Dec 2022

When should you use Power BI Dataflows vs Power BI Datamarts?


I have previously written articles on the What, How, When and Why of Power BI Datamarts and Power BI Dataflows. Have a look below if you want to get a quick overview of the two features of Power BI Service.

But when should you use what?

Power BI Dataflows vs Power BI Datamarts

Let’s revisit the When of both Power BI Dataflows and Power BI Datamarts!
Use casePower BI DataflowPower BI Datamart


Tables that are reused throughout your organization
Dataflows are particularly great if you are dealing with tables that you know will be reused in your organization, e.g. dimension tables, master data tables or reference tables.You can also reuse a datamart, but it is unnecessary to build a datamart to solve this use case.


Azure Machine Learning and Azure Cognitive Services
If you want to take advantage of Azure Machine Learning and Azure Cognitive Services in Power BI this is available to you through Power BI Dataflows. Power BI Dataflows integrates with these services and offers an easy self-service drag-and-drop solution for non-technical users. You do not need an Azure subscription to use this but it requires a Premium license. Read more about ML and Cognitive Services in Power BI Dataflows here.When looking through Power BI Datamarts today I cannot see this functionality easily available. Dataflows was however designed to solve this use case and is, in my opinion, a good place to start.


Incremental refresh
Power BI Dataflows provides the possibility to incrementally refresh your data based on parameters to specify a date range. This is great if you are working with large datasets that are consuming all your memory. However, you need a premium licence to use this feature.It is also possible to set up incremental refreshes for your separate tables in your Datamart. If you have a couple of large tables within your datamart, this could be a nice feature to take advantage of.


Ad-hoc SQL querying and data exploration
You can explore your data through a dataflow, but it is not possible to run SQL queries with dataflows.Datamarts are particularly great if you want to do ad-hoc querying or data exploration of your data as sort, filter, and do simple aggregation visually or through expressions defined in SQL
This image has an empty alt attribute; its file name is image-17.png

Self Service Data modelling
Dataflows do not support setting up relationships between tables, building measures or writing DAX. A great thing with Power BI Datamarts is that you can model your star schema right in Power BI Service. That way you do not have to wait for the data warehouse to make smaller (or larger) improvements or changes to your data model as you can do these changes yourself – but remember that permanent transformations should be moved as close to the source as possible. This also enables Mac users to do some modelling in Power BI Service.


Need to connect to your data in Power BI Service through a SQL endpoint.
Not possible with dataflows.Power BI datamarts provide a SQL end-point to your data. This is great if that is a requirement from developers or data analysts. You can then use database tools as SSMS to connect to your datamart as any other DB, and run queries.

Let me know what you think and if you have other use cases where the tools should be compared.

Useful links:

What, How, When and Why on Power BI Deployment Pipelines [Hill Sprint] — 7. Dec 2022

What, How, When and Why on Power BI Deployment Pipelines [Hill Sprint]

The What, How, When and Why on Power BI Deployment Pipelines!

  1. What are Power BI Deployment Pipelines?
  2. How can you set up Power BI Deployment Pipelines?
  3. When should you use Power BI Deployment Pipelines?
  4. Why should you use Power BI Deployment Pipelines?

What are Power BI Deployment Pipelines?

Power BI Deployment pipelines makes it possible for creators to develop and test Power BI content in the Power BI service, before the content is consumed by users. It provides a lifecycle management solution for your Power BI content!

Deployment Pipelines creates a development, test and production workspace for you where you can view the differences between the environments. You can also set up deployment rules that change your data source when deploying from one environment to the next. Like changing from test data in the test workspace to production data in the production workspace.

You can also review your deployment history to monitor the health of your pipeline and troubleshoot problems.

Hence, Deployment Pipelines can help you collaborate with other developers, manage access to testers and automate data source connections.

If you want to learn more on Power BI Deployment Pipelines, you can read the documentation from Microsoft here.

What Deployment Pipelines do NOT help you with is version control. This brings us on to another existing topic that I have not yet created a blog post on – Azure DevOps and Power BI. However, my friend Marc has. You can read his post on how you can utilize Azure DevOps to manage version control on your Power BI Reports here.

How can you set up Power BI Deployment Pipelines?

You set up a Power BI Deployment Pipelines in Power BI Service. This is done through the menu on your left side when login into Power BI Service OR directly in the workspace you want to assign to a Deployment Pipeline.

You then follow these steps:

  1. Click “Create a pipeline”

2. Fill in the name of the pipeline. This needs to be unique for your organization. Make sure the name makes sense for other developers and fill in a description as well.

3. Assign a workspace (if you did not create the pipeline directly from the workspace)
If you created the deployment pipeline directly from the workspace you need to decide if you want to assign the existing workspace to Development, Test or Production. Essentially you are deciding if the existing workspace already is a production environment or a development environment (it could also be a test environment, but dev and prod would probably make the most sense for most).

In the following example, the Development environment was chosen as the starting point/the workspace was assigned to Development.

4. Choosing “Deploy to test” will automatically generate a test workspace for you. Inside this workspace, you can then decide to create an app that can be used to view the content for business testers if you don’t want to give access to the workspace.

5. Choosing “Deploy to production” will automatically generate a production workspace for you. This will be where you provide access to the reports and datasets, datamarts and dataflow to your business analysts that want to take advantage of these assets, and where you create your app to provide access for report consumers.

6. You can change the name of the workspaces by clicking on the ellipse and choosing “Workspace settings”

7. By selecting the lightning bolt above the Test or Production environment you open up “Deployment Settings”.

Depending on the data source you can define deployment rules for your data source. For instance, you can change the file path, database or parameter when deploying from test to production changing the data from test data to production data. Nice!

8. Create apps on top of the development, test and production workspace as needed and assign access to relevant users.

You need premium capacity to get access to Power BI Deployment pipelines.

When should you use Power BI Deployment Pipelines?

When there is a need to provide business users with a test environment to test reports, test the layout of the app or new functionality without mixing with reports that already are in production. Additionally, when there is a need to provide more technical testers with access to a workspace with only content that is ready for testing.

When there are multiple report developers and business domains and there is a need for collaboration and exploration. The development workspace provides an area where multiple Power BI developers can make changes and adjustments to the same files (as long as these changes are made in Power BI Service).

When there is a need to separate test data from production data, where reports should not connect to production data unless the report itself is ready for production.

Why should you use Power BI Deployment Pipelines?

Power BI Deployment Pipelines help us with the lifecycle management of Power BI content

  • Provides a tool to improve and automate the management of the lifecycle of Power BI content
  • Provide a visual overview of developer content and the gap between development, testing and production.
  • Improved access control as you can provide data analysts with access to test apps, and super users to test workspaces instead of being forced to send the reports to your production workspace/app. You also ensure that production data is not made available unless the content is ready for production.
  • Provides collaboration environment for developers
  • Automates source connections when deploying

Useful links:

What are Hill Sprints?

I am having a series called hill sprints (since we are climbing mountains – hehe) that will provide a to the point introduction on a topic covering the What, How, When and Why.

Why hill sprints?

Hill sprints are essentially a form of interval training – probably one of the more intense (but engaging) options. They are quick, brutal and to the point. Let me know if you have another fun analogy towards climbing mountains that would make sense for a series name! (Having way to much fun with this)

First Hill Sprint Series will be on Power BI Service. In this series we will go through some of the main components in Power BI Service, explaining what is it, how can you set it up, when should you use it, and why should you use it.

Hopefully, this can provide some quick insights and knowledge on the components and help decide if this is the tool for you with your current setup or challenge.

What, How, When and Why on Power BI Datamarts [Hill Sprint] — 8. Nov 2022

What, How, When and Why on Power BI Datamarts [Hill Sprint]

The What, How, When and Why on Power BI Datamarts!

  1. What are Power BI Datamarts
  2. How can you set up Power BI Datamarts?
  3. When should you use Power BI Datamarts?
  4. Why should you use Power BI Datamarts?

What are Power BI Datamarts

Power BI Datamarts are a self-service analytics solution that provide a fully managed database that enables you to store and explore your data in a relational and fully managed Azure SQL DB.

That means that you can connect your sources, transform these, set up relationships between the tables and build measures – resulting in a data model in Azure SQL database that you can connect to as any other database.

Datamarts are not a new thing though. A datamart in the world of a data warehouse is the access layer containing a focused version of the data warehouse for a specific department that enables analytics and insights to the business. A datamart could be a star schema designed to provide specific KPIs.

Hence, in Power BI Datamarts we can now build this access layer for specific business domains in Power BI Service as a star schema with relationships and measures.

If you want to learn more on Power BI Datamarts, you can read the documentation from Microsoft here.

How can you set up Power BI Datamarts?

You set up a Power BI Datamarts in Power BI Service. This is done through the workspace you want to hold the datamarts and by clicking “New”.

You then do the following:

  1. Choose source type and connect to your source
  2. Load the data source and transform this (if you want to) in Power Query
  3. Then the data source is loaded into a datamart. You can now do the following based on what you want and need to do to your data:
    • Set up relationships
    • Build measures
    • Run queries with SQL
    • Run queries using low-code functionality

You need premium capacity or premium per user to get access to Datamarts.

When should you use Power BI Datamarts?

Datamarts are particularly great if you want to do ad-hoc querying or data exploration of your data as sort, filter, and do simple aggregation visually or through expressions defined in SQL

A great thing with Power BI Datamarts is that you can model your star schema right in Power BI Service. That way you do not have to wait for the data warehouse to make smaller (or larger) improvements or changes to your datamodel as you can do these changes yourself. If these changes should be permanent or a in between solution while one wait for the datawarehouse depends on the governance that is set up.

In addition, Power BI datamarts provide a SQL end point to your data. This is great if that is a requirement from developers or data analysts. You can then use database tools as SSMS to connect to your datamart as any other DB, and run queries.

Why should you use Power BI Datamarts?

Power BI Datamartscan help us solve a range of challenges with self-service BI. Many of these are similar gains as one could get from Power BI Dataflows.

  • Improved access control as you can provide data analysts with access to the datamart instead of direct access to the data source
  • One source of truth for business logic and definitions
  • Provides a tool for standardization on the ETL process
  • Enables self-service BI for non-technical users
  • Enables reusability

Specific worth from datamarts (compared to Power BI dataflows) are:

  • Self-service solution for quering and explore data for data analysts, as well as for non-technical users as you can query the datamart using low-code functionality
  • Reduce time to production if the alternative is to wait for the needed changes or development to be delivered through the data warehouse. Also, Datamarts developers do not need code experience, and can ingest, transform and prepare the models using existing knowledge from Power Query and Power BI Desktop.
  • Power BI Datamarts support row-level-security (where Power BI Dataflows do not)

Useful links:

What are Hill Sprints?

I am having a series called hill sprints (since we are climbing mountains – hehe) that will provide a to the point introduction on a topic covering the What, How, When and Why.

Why hill sprints?

Hill sprints are essentially a form of interval training – probably one of the more intense (but engaging) options. They are quick, brutal and to the point. Let me know if you have another fun analogy towards climbing mountains that would make sense for a series name! (Having way to much fun with this)

First Hill Sprint Series will be on Power BI Service. In this series we will go through some of the main components in Power BI Service, explaining what is it, how can you set it up, when should you use it, and why should you use it.

Hopefully, this can provide some quick insights and knowledge on the components and help decide if this is the tool for you with your current setup or challenge.

What, How, When and Why on Power BI Dataflows [Hill Sprint] — 3. Nov 2022

What, How, When and Why on Power BI Dataflows [Hill Sprint]

Let’s do a hill sprint on Power BI Dataflows: The What, How, When and Why of Power BI Dataflows!

I am having a series called hill sprints (since we are climbing mountains – hehe) that will provide a to the point introduction on a topic covering the What, How, When and Why.

Why hill sprints?

Hill sprints are essentially a form of interval training – probably one of the more intense (but engaging) options. They are quick, brutal and to the point. Let me know if you have another fun analogy towards climbing mountains that would make sense for a series name! (Having way to much fun with this)

First Hill Sprint Series will be on Power BI Service. In this series we will go through some of the main components in Power BI Service, explaining what is it, how can you set it up, when should you use it, and why should you use it.

Hopefully, this can provide some quick insights and knowledge on the components and help decide if this is the tool for you with your current setup or challenge.

  1. What are Power BI Dataflows
  2. How can you set up Power BI Dataflows?
  3. When should you use Power BI Dataflows?
  4. Why should you use Power BI Dataflows?

What are Power BI Dataflows

Power BI Dataflows are essentially Power Query Online that provide a self-servie data integration tool.

This way you can create reusable transformation logic and build tables that multiple reports can take advantage of.

How can you set up Power BI Dataflows?

You set up a Power BI Dataflow in Power BI Service. This is done through the workspace you want to hold the dataflow and by clicking “New”.

Here you can choose if you want to create a new dataflow or build on top of an existing one.

For more information on how to set this up you can follow the Microsoft documentation here.

When should you use Power BI Dataflows?

Dataflows are particularly great if you are dealing with tables that you know will be reused a lot in your organization, e.g. dimension tables, master data tables or reference tables.

If you want to take advantage of Azure Machine Learning and Azure Cognitive Services in Power BI this is available to you through Power BI Dataflows. Power BI Dataflows integrates with these services and offers an easy self-service drag-and-drop solution for non-technical users. You do not need an Azure subscription to use this but requires a Premium license. Read more about ML and Cognitive Services in Power BI Dataflows here.

In addition, Power BI Dataflows provides the possibility to incrementally refresh your data based on parameters to specify a date range. This is great if you are working with large datasets that are consuming all your memory – but you need a premium licence to use this feature.

Why should you use Power BI Dataflows?

Power BI Dataflows can help us solve a range of challenges with self-service BI.

  • Improved access control
  • One source of truth for business logic and definitions
  • Provides a tool for standardization on the ETL process
  • Enables self-service BI for non-technical users
  • Enables reusability