With its low-code approach, Microsoft Fabric enables anyone to take on tasks that once required a data engineering background. It accelerates development, supercharges workflows, and integrates seamlessly with AI, both enabling AI and using AI to make you even more productive. Definitely super cool. 😎

But with this new speed and power comes a new level of responsibility. As AI becomes deeply embedded in our tools and decisions, the old adage still holds true: garbage in, garbage out. That’s why the architecture of your Microsoft Fabric environment matters more than ever.
Why? Because with the ease and speed of things in Fabric today, it is SO SIMPLE to create things, so how fast can you create a mess for yourself? Anyone using Power BI for a couple of years and going with the self-serve approach? Then you know what I am talking about.
So, a strong foundation ensures compliance, security, and data integrity to ensure you never lose control, end up with duplicates and ultimately low-quality data, because when AI acts on bad data or a flawed setup, the consequences can scale just as fast as the benefits.
Let’s take a look at the what initial steps you should consider for your Fabric architecture and why!

Jump to:
- How should you structure your items (Lakehouses/Warehouses) in Microsoft Fabric?
- How should you structure your workspaces in Microsoft Fabric?
- How should you structure your Domains in Microsoft Fabric?
- How should you structure your Capacities in Microsoft Fabric?
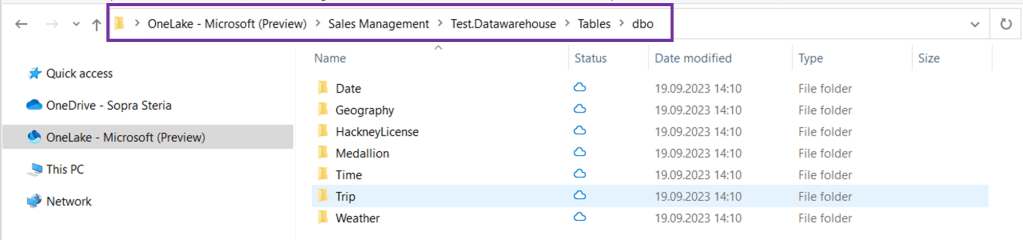
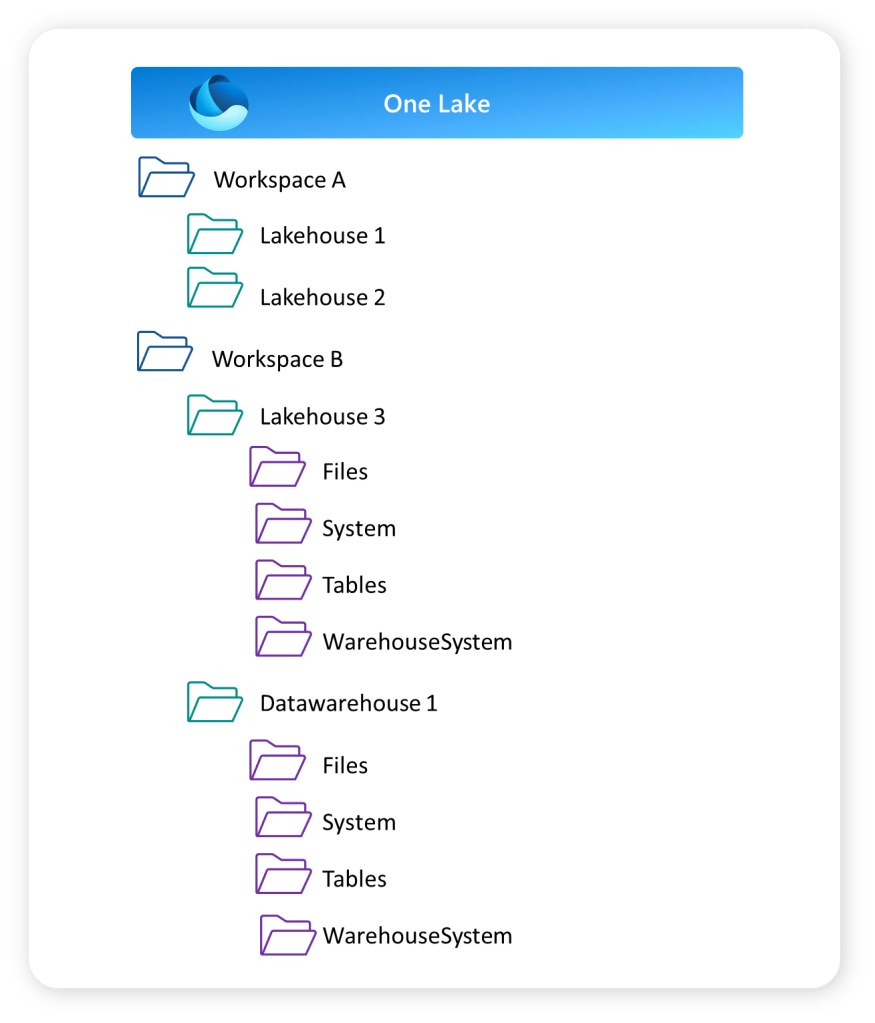
How should you structure your items (Lakehouses/Warehouses) in Microsoft Fabric?
I like to think of Fabric in this order when making the first decisions on the HOW we are going to set things up. Items define your options on workspaces, and workspaces define your options on domains and capacities. So, the first thing you need to think about is item separation.

Let’s use the medallion architecture as an example throughout this blog post to have something many are familiar with.

Would you like to separate the bronze, silver and gold layer into separate items – or do you want to group them into one lakehouse or warehouse? Or a mix?


✅ Pros of Item Separation in Microsoft Fabric
| Clear Layer Boundaries | Enforces architectural clarity between Bronze, Silver, and Gold layers. Minimizes accidental data leakage between stages. |
| Enhanced Security & Governance | Enables more granular control over access (e.g., only data engineers consume Bronze; analysts consume Gold). |
| Improved Discoverability | Easier for consumers to find the right data at the right stage. Promotes documentation and ownership via dedicated spaces. E.g. if you want to separate ownership on bronze/silver layer for source-aligned data products, while the gold layer provides consumer-aligned data products. Improves discoverability (and lineage) in Purview as Items are best supported today. |
| Better Modularity & Scalability | Each layer can evolve independently (e.g., switching ingestion logic in Bronze without touching Gold). Encourages a microservice-style approach where each layer is self-contained. |
| Supports Interoperability | Enables integration with various tools and personas by decoupling processing stages. |
⚠️ Considerations of Item Separation in Microsoft Fabric
| Increased Complexity | More items to manage. Requires well-defined conventions and documentation. |
| Operational Overhead | May lead to duplication of effort (e.g., repeated metadata or pipeline setup across layers). Monitoring and orchestration across items become more complex. |
| Risk of Over-Engineering | Not all projects need full item separation; using it universally can slow down small teams. Risks “compliance theater” without real added value if not paired with strong practices. |
| Dependency Management | Inter-layer dependencies may become fragile if naming, versioning, or schema tracking isn’t standardized. |
Use it when: You need strong governance, multiple teams, or enterprise-scale structure.
Skip it when: You’re working fast, solo, or on smaller, agile projects.
How should you structure your workspaces in Microsoft Fabric?
When you have made your choices on item separation, you are ready to consider your workspace separation, as the item separation also (naturally) enables workspace separation.
Let’s use the medallion architecture as an example again.
Do you want to have all your layers in one workspace, or separate them across workspaces, or a mix?


✅ Pros of Workspace Separation in Microsoft Fabric
| 1. Self-Contained Environments | Encapsulation of logic and data for each team. Reduced risk of accidental interference across unrelated areas. Easier testing and deployment of updates in isolation. |
| 2. Improved Discoverability | Easier to navigate than a massive, centralized workspace. Reduces cognitive load for analysts and consumers. Improves discoverability in Purview. |
| 3. Stronger Governance & Access Control | Define permissions on a need-to-know basis using the workspace for different development teams. Then have a more granular option for access control on the item level as well if needed. Ensure compliance by segmenting sensitive data (e.g. some bronze data might be sensitive compared to gold layer) |
| 4. Domain-Oriented Ownership | Teams can own, maintain, and evolve their domain-specific workspaces independently Reduces bottlenecks by avoiding centralized gatekeeping Encourages accountability and autonomy |
| 5. Better Observability | Errors, performance, and usage can be scoped per workspace Easier to trace lineage and operational issues within contained environments |
⚠️ Cons of Workspace Separation in Microsoft Fabric
| 1. Cross-Workspace Dependencies Can Be Painful | Sharing datasets between workspaces can involve more manual effort or pipeline complexity. Lack of strong cross-workspace lineage tracking increases risk of versioning issues. |
| 2. Coordination Overhead | Schema changes or upstream updates must be communicated across teams. (Should you consider data product contracts?) Governance, naming conventions, and SLAs must be actively enforced. |
| 3. Risk of Fragmentation | Workspaces can become inconsistent in structure, naming, and metadata practices Onboarding new users becomes harder if standards vary widely |
| 4. Initial Barrier to Entry | Setting up multiple workspaces might feel like overkill Single-workspace setups may be better for rapid prototyping or agile development |
Use when: You have multiple domains or teams, need tight access control, or want to scale governance.
Avoid when: You’re prototyping, working with a small team, or need fast iteration across datasets.
*a consideration not discussed in this article for workspace separation is CI/CD
How should you structure your Domains in Microsoft Fabric?
When you have your workspace plan ready, you can take a look at domains.
Do you want to separate you domains on business use case alone, on technical teams, on data source, or a mix?


If you use a data mesh approach, you might want each domain to own the entire data flow from bronze to silver.


Suppose you want to enable your business domains, but still want to take advantage of some centralization in making the different data layers available. In that case, you might want to look at a domain separation as shown above.
✅ Pros of Domain Separation in Microsoft Fabric
| 1. Reflects Business Structure | Organizing data by domain mirrors your org chart. This reduces confusion and aligns data strategy with business operations. |
| 2. Clear Ownership and Accountability | Each domain owns its data products. This fosters a culture of accountability and ensures data is maintained by those who understand it best. |
| 3. Decentralized Policy Enforcement | Domains can enforce their own data quality, security, and compliance rules within their boundary. This enables scalability without relying solely on a central team. |
| 4. Improved Governance and Observability | Smaller, domain-focused scopes are easier to govern. Monitoring usage, managing permissions, and auditing access becomes simpler and more meaningful. |
| 5. Autonomy and Speed | Teams can build and release data products at their own pace. They don’t need to wait on a centralized team to deploy pipelines or models. |
⚠️ Cons of Domain Separation in Microsoft Fabric
| 1. Risk of Silos | If domains don’t collaborate or share standards, data silos can (re-)emerge inside of Fabric. Interoperability must be intentionally designed. |
| 2. Duplication of Effort | Multiple teams might build similar models or transformations independently. Without coordination, this wastes time and creates inconsistency. |
| 3. Tooling and Training Overhead | Each domain team needs enough skill and support to manage its own pipelines, models, and compliance needs. This requires investment. |
Use it when: Your org has distinct teams/domains and you want scalable ownership.
Avoid it when: You’re early in your journey or lack governance maturity.
How should you structure your Capacities in Microsoft Fabric?
Then finally, let’s take a look at your choices when it comes to Fabric capacities.
Do you want to use capacity separation to mirror your business domains, technical teams, environments or a mix?


If your organization requires separate cost management across business domains, you probably want to mirror the capacities and the domains.

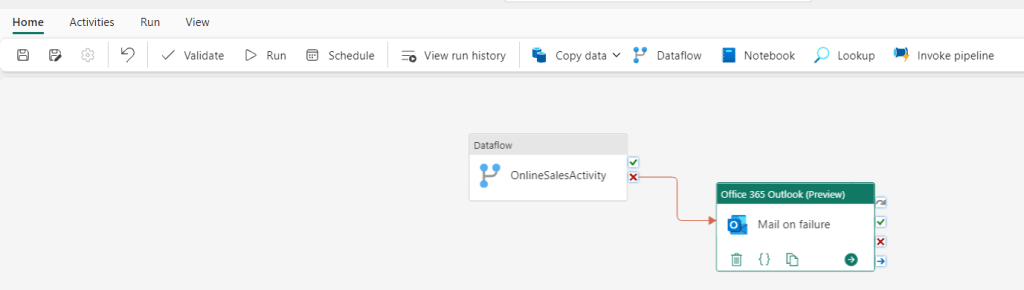
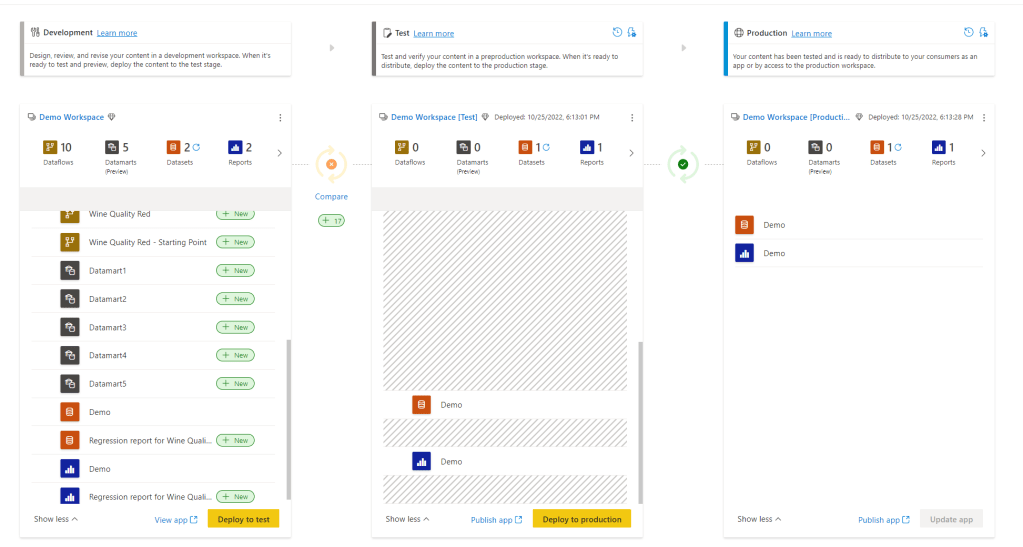
Another separation you might consider instead of or in combination with the domain separation is to separate the capacities for the different environments. This can ensure performance. If you are taking advantage of federated development teams, you run a higher risk of someone creating a crazy dataflow that kills the entire capacity. Separating development and production can therefore be wise. This is also a way to maximise cost savings, as the development capacity does not need to be on 24/7 and can be scaled up and down as needed.

If your organisation exists across regions, you might also want to consider separating your environments based on different capacity regions. Be aware that it is currently not possible to move Fabric items across regions without a support ticket to Microsoft. Take some time to consider your needs and use cases before splitting.
✅ ️ Pros of Capacity Separation in Microsoft Fabric
| 1. Performance Isolation | High-demand domains won’t be bottlenecked by low-priority processes elsewhere. Development efforts won’t throttle production environments. |
| 2. Cost Transparency & Accountability | Clearer tracking of compute and storage consumption per business domain/unit or team. Easier chargeback/showback models for budgeting or internal billing Data-driven capacity planning (who needs more/less and why) |
| 3. Optimized Scaling | Critical business domains can be scaled up. Lightweight domains can be throttled or moved to shared capacity. |
⚠️ Cons of Capacity Separation in Microsoft Fabric
| 1. Potential Resource Waste | Small or inactive domains may not fully utilize their assigned capacity. Wasted potential if workloads don’t justify a dedicated capacity. Teams may leave unused resources running (e.g., long-lived Spark jobs) that are not discovered by the separate domains. |
| 3. More Complex Governance | Domain-level cost and performance management requires clear policies for scaling, shutting down idle jobs, prioritisation and governance around assigning capacity (shared vs dedicated). Increased administrative overhead to right-size environments. |
Use it when: you need performance isolation between teams or layers, want cost tracking per domain or department, domains have high or variable workloads, or you have governance in place for managing capacity.
Avoid it when: workloads are small or early-stage, teams lack cost or performance monitoring maturity, shared capacity meets your needs, or you want to minimize setup and management overhead.
Hope you found this article useful!
Stay updated on new blog posts and videos by subscribing to @GuyInACube on YouTube, follow me on LinkedIn or subscribe to the newsletter for this blog below to get the newest updates!